
Debris Flow Hazards in the Santa Cruz Mountains
A GEOLOGIST “TRANSLATES” HAZARD MAPS
By Gail Mahood
Introduction
Anyone driving up Hwy 9 has spotted the new electronic signs warning “Debris Flow Hazards Ahead” and urging citizens to sign up for the Code Red alert system. This is part of the Santa Cruz County response to the debris flow hazards the San Lorenzo Valley is facing this coming winter in the aftermath of the CZU Fire.
Recently burned areas are prone to debris flows because the fire removes vegetation holding the soil and rocks in place. In addition, ash and the waxy residue of burned plant material on the ground surface repel water, causing rainwater to sheet off rather than soak into the ground. Loose rock, soil, ash, and downed logs are mobilized and channeled into creeks. Any storm that produces a period of intense rainfall (greater than ¼ inch in 15 minutes or ¾ inch in an hour) within the CZU Fire burn zone poses the risk of producing debris flows. Debris flows are dangerous because they travel at high velocities (faster than you can run), and cause severe damage in areas they inundate by transporting boulders, trees, and debris that destroy buildings on impact and can sweep away homes and automobiles. Low-lying areas downstream from the burned area are at risk from being inundated by debris flows.
Santa Cruz County response to debris flow hazards this coming winter
The County response to the debris flow hazard began with a special presentation to the Board of Supervisors on debris flows on September 29, 2020, and continued with a Fire Recovery Town Hall on October 7, and additional virtual Town Hall meetings in November that focused on evacuation plans. Video recordings of these events are available on the Facebook page of Supervisor Bruce McPherson (https://www.facebook.com/BruceMcPhersonSC).
The County established a Fire Recovery website that includes a page on “Debris Flows/Mudflows” (https://www.santacruzcounty.us/FireRecovery/DebrisFlowsMudflows.aspx).
It includes a list of links to many useful sites, including access to three geologic studies with assessments of hazards that were used by the County in developing its response to debris flow hazards during the upcoming rainy season.
Because debris flows are fast-moving and their paths are unpredictable in detail, especially once they leave steep, narrow canyons and spread out on alluvial fans and rivers terraces where people tend to live, temporary evacuation from areas at risk in advance of predicted heavy rainfall events is the best way to save lives. As a result, the County will issue evacuation warnings 48 hours and mandatory evacuation orders 24 hours prior to forecasted high-intensity rainfall events,.
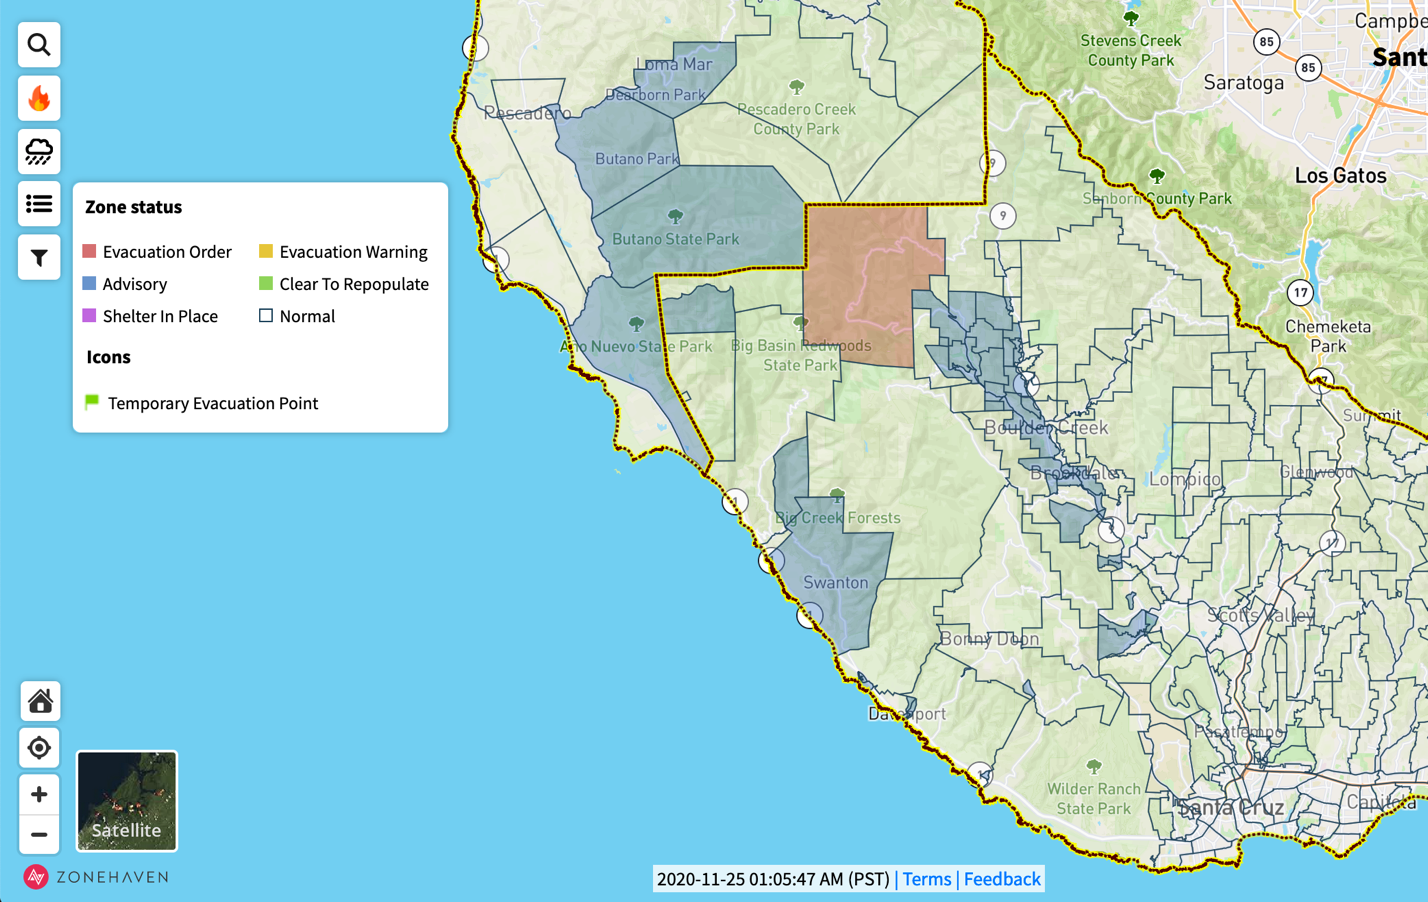
The County recently issued two slightly different maps related to debris flow hazards and evacuations. The one depicted on the County “Debris Flow/Mudflow” page and discussed in recent virtual Town Hall meetings has polygons colored light blue (“elevated risk”) and dark blue (“neighborhoods determined to be at highest risk for debris flow or blockade, and will likely see evacuations during periods of intense rainfall”). The map referenced in the Debris Flow Evacuation Preparation brochure issued by the Santa Cruz County Sheriff’s Office that is currently being distributed by neighborhood canvassing is found at https://community.zonehaven.com/. Individuals can use this map, as they did the analogous Zonehaven map during the CZU Fire, to stay current on evacuation warnings and orders.
These are not hazard maps in the way geologists or geomorphologists think of them, in that they do not show all areas at risk within the County (only areas with occupied homes), and they do not distinguish between multiple levels of hazard. They are essentially evacuation maps. The blue evacuation polygons on these maps encompass areas with debris flow hazards ranging from inconvenience (being unable to exit a street due to blockage by flooding or a debris flow elsewhere) to mortal danger (near active channels of creeks or alluvial fans draining watersheds capable of producing large, high-energy debris flows).
Why it is important for the public to understand the distribution of debris flow hazards
As a geologist, and as someone who dealt with volcanic hazards maps her entire professional career, I think it is important that the public understand the different levels of debris flow hazard and how those relate to the location of their homes and businesses or roads that they routinely travel. My experience as part of the volcanological community over the past 35 years, following the needless death of 20,000 people buried by an eruption-triggered debris flow in Armero, Columbia, is that to reduce loss of life it is essential to educate the entire affected population so they (1) understand the seriousness of debris flow hazards and will comply with evacuation orders, and (2) understand debris flow processes sufficiently that they will have the situational awareness to react appropriately if the conditions seem ripe for production of debris flows, even in the absence of a warning or evacuation order.
Why is this important for San Lorenzo Valley in particular?
- Life safety. Owners of homes and businesses in the highest hazard zones need to understand the dire risk, so they don’t succumb to “evacuation fatigue” if there are false-alarm evacuations, as there will no doubt be. I believe people living in the highest hazard zones should be contacted individually by the County Geologist (or delegate) and told that there is a finite chance that their home will be hit by a highly destructive debris flow that threatens the life of anyone inside.
- Better preparation for evacuation. Knowing the level of hazard will allow the public to prepare for evacuation appropriately. For people at risk only of the inconvenience of their street being cut off, evacuation is relatively easy as their evacuation will be at most a couple of days. Where there is a low probability of a small debris flow or flooding effecting some part of their property, people would probably button up the homes so nothing floats away, consider putting up sandbags prior to evacuation, and, just in case a debris flow or flood is larger than predicted, take important documents. People living in the highest hazard zones would need to evacuate as they might if they feared their homes would be destroyed by fire—taking documents, valuables, and keepsakes—and should be repared for a lengthy evacuation. As there is no way to mitigate against moderate-sized to large debris flows, for peace of mind, people in the highest hazard areas might consider living somewhere else for the 2-3 months that rainfall is heaviest. This is especially true for people with diminished mobility or lots of animals, which make evacuation difficult and time-consuming.
- Inaccurate weather forecasts. Weather forecasts are not 100% accurate, so there is a possibility that a storm doesn’t trigger an evacuation order but then produces rainfall intense enough to trigger a debris flow. If people understand their level of risk, those in moderate to high hazard zones will choose to self-evacuate if weather is more severe than forecast.
- Evacuation routes. At the virtual Town Hall meetings the Sheriff’s Office stated that they did not intend to advise people about what routes to take to evacuate because with 24 hours of notice, they thought people should be able to find their own way out by consulting County road closure alerts. Knowing what portions of Hwy 9 and Hwy 236 and major roads such as Graham Hill Road and Bear Creek Road may be affected by debris flows or flooding due to heavier-than-normal run-off, clogging of culverts by downed burned logs, or bulking of Boulder Creek and the San Lorenzo River by debris would assist homeowners in developing several alternatives for evacuation depending on road conditions.
Sources of geologic, geomorphologic, and hydrologic information on debris flow hazards
To produce a summary of debris flow hazards arising from the CZU Fire burn zone, I have relied on three reports made available by the County, augmented by my own field observations. These three reports are technical, but contain useful information of interest to the public, so I think it is important to summarize and “translate” them so that individuals within and downstream of the CZU Fire burn zone can determine the location of their homes and businesses with respect to debris flow hazards and plan their evacuation procedure and routes accordingly.
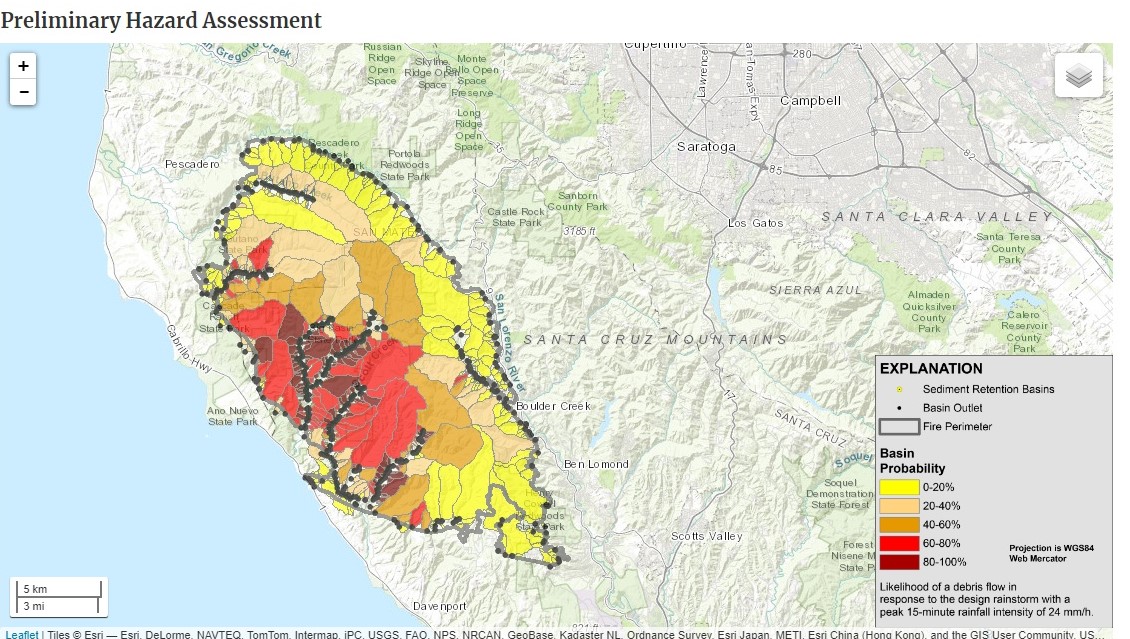
- Emergency Assessment of Post-Fire Debris Flow Hazards: CZU Lightning Fire was issued by the U.S. Geological Survey immediately after the fire. This map shows the results of modeling for each drainage with headwaters in the CZU Fire burn area the probability that a debris flow will be generated in a single, high-intensity rainfall event and the volume of debris flow that can potentially be generated. Combining these modeled values, results in an estimate of the overall hazard (low, medium, or high). The overall hazard increases with steeper slopes, severe burning, easily eroded bedrock and soil, and the size of the watershed. This map does not, however, show downstream runout paths of predicted debris flows. It is available here: https://landslides.usgs.gov/hazards/postfire_debrisflow/detail.php?objectid=299

Map showing level of hazards from debris flows generated in basins within the CZU Fire burn zone. U.S. Geological Survey Emergency Assessment of Post-Fire Debris Flow Hazards: CZU Lightning Fire
- CALFIRE and the California Department of Conservation issued a report on October 1, 2020 entitled Watershed Emergency Response Team Evaluation: CZU Lighting Fire (https://www.smcgov.org/sites/smcgov.org/files/CZU%20Lightning%20Complex%20WERT%20Final%2010-6-20.pdf). Referred to as the “WERT report”, it assessed post-fire rockfall, debris flow, and flooding hazards. It contains an elaboration on the U.S. Geological debris flow hazard model, and, based on field work, also includes maps of areas at risk from debris flows downstream of the burn zone. These maps also show U. S. Geological Survey “watchstreams” (streams that will be subject to debris flows or sediment- and debris-laden floods if the watersheds above them generate a debris flow), and show areas of creek and river floodplains considered by FEMA/DWR to be subject to flooding during severe winter storms. After the fire, these areas will be more prone to flooding due to increased run-off in the burn zone or due to bulking of creeks by debris.
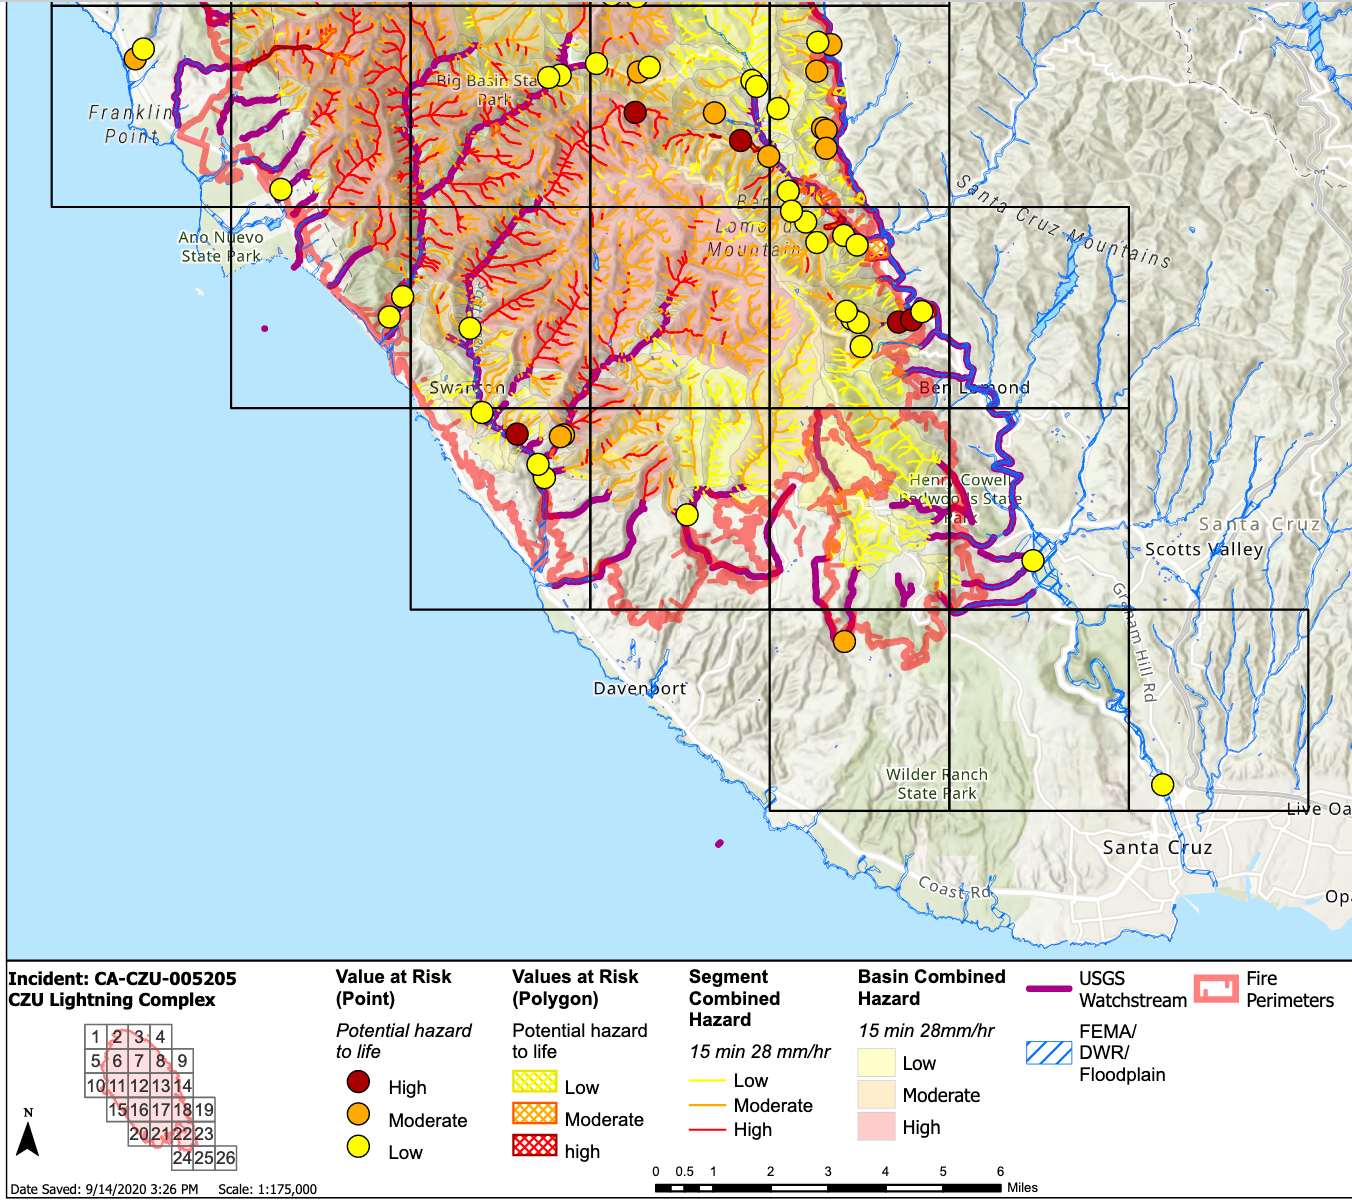
A portion of the WERT Report debris flow and flooding hazard map.
- As the most difficult areas to predict the paths of debris flows are alluvial fans, more detailed mapping was done by geologists and geomorphologists employed by the County and the California Geologic Survey of areas from Brookdale to Jamison Creek where alluvial fans are common and are favored sites for homes and businesses. Issued November 2, 2020, the California Geological Survey Boulder Creek Post-WERT Study (https://www.santacruzcounty.us/Portals/0/County/FireRecovery/pdfs/CZU_OES_Mission_Task_2020-SOC-42611_Boulder_Creek_Post_WERT_Study_CGS_Final_20201102.pdf).
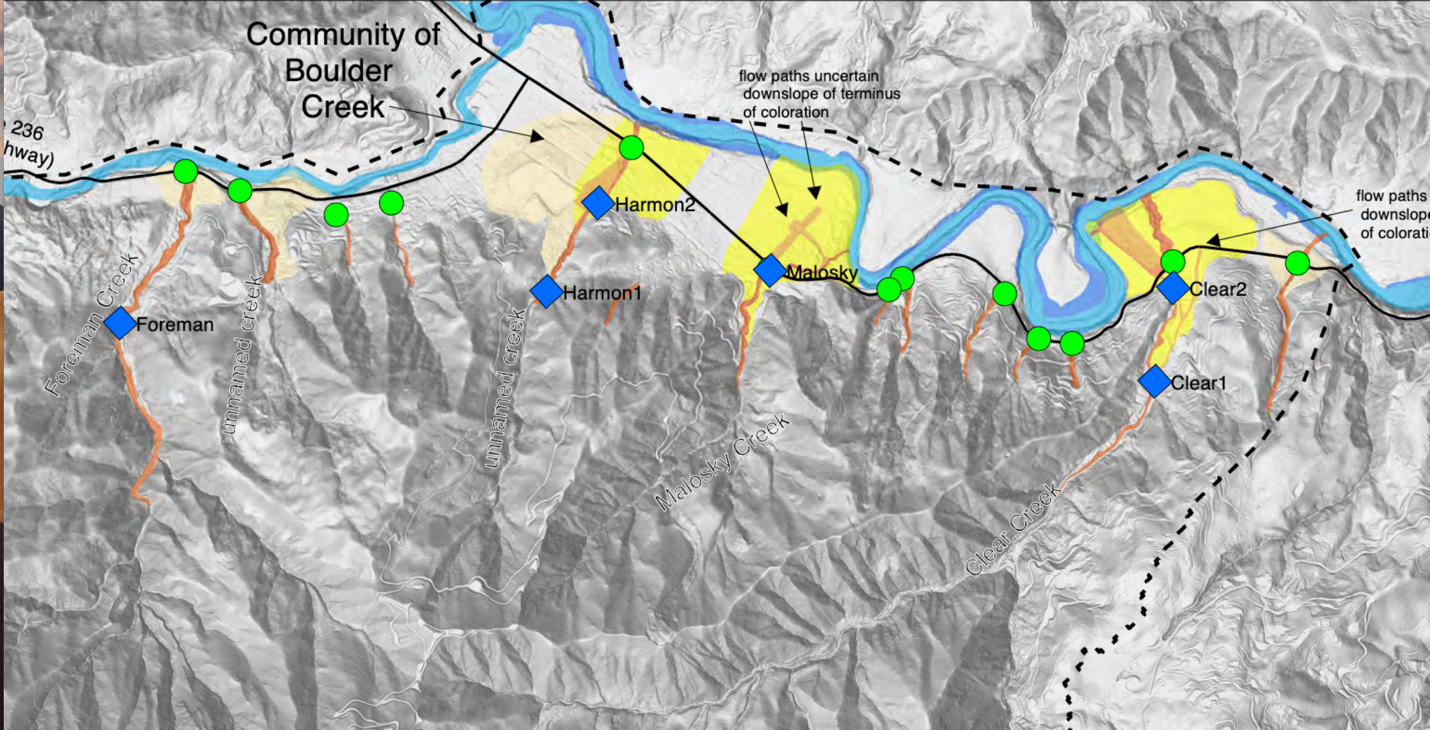
A portion of the California Geological Survey Boulder Creek Post-WERT Study hazard map, Plate 1b. Notice that the direction North is to the left.
Summary of hazards from debris flows and debris-laden floods by area
This coming winter, more lives and property are at risk from debris flows downstream of the CZU burn zone than in the burn zone itself because there are few homes near the bottoms of steep creeks in the burn zone, whereas there are many homes and businesses located on relatively flat areas on river terraces or alluvial fans along Boulder Creek and the San Lorenzo River.
West side of Ben Lomond Mountain
The most severe debris flow hazards are on the west side of Ben Lomond Mountain, where a combination of intense burning, steep slopes, and easily eroded sedimentary bedrock combine to make for Moderate to High basin probabilities of 60-100% of a debris flow forming in a single high-intensity rain event in West and East Waddell Creek, Scott Creek, Big Creek, and Molino Creek. Based on the hazards map, it wouldn’t be surprising if Highway 1 were hit by debris flows this coming winter north of Davenport Landing and north and south of Ano Nuevo State Park.
The area around Bonny Doon has a Low probability of debris flows, largely because the area is relatively flat, but also because the burn intensity was low to moderate. Homes along Empire Grade are unlikely to be subject to large debris flows because they are on a ridge. Davenport lies adjacent to the floodplain of San Vicente Creek, which along with its major tributary Mill Creek, head in the burn zone around Bonny Doon. Some of the tributary basins, by virtue of their large size, are capable of generating moderate-sized debris flows. So, although the probability and hazard are considered Low, there is a possibility of inundation of the lower reaches of San Vicente Creek, which is subject to occasional winter flooding in any case.
Highway 9 and 236 corridors
The debris flow hazards for the Hwy 9 and 236 corridors are assessed as Low to Moderate. This is because the east side of Ben Lomond Mountain is so steep, most of the watershed areas drained by creeks are small, limiting the amount of sediment and debris that can be swept away and incorporated into a debris flow.
All the basins but one draining eastward into the San Lorenzo River are considered Low hazard, due to the low probability (0-20%) of debris flows being generated. The exception is the Clear Creek drainage, which has a Moderate hazard due to it having a moderate (20-40%) probability of generating a large debris flow in a single intense rainfall event. Where Clear Creek emerges from its deep V-shaped channel at the mountain front, it has over the years deposited sediments where the water slows down on flatter ground, forming an alluvial fan. As is common along the Hwy 9 and 236 corridor, the gently sloping fan surface is an attractive place to build homes. Much of Brookdale is built on this alluvial fan emanating from where Clear Creek emerges from the mountains near the Brookdale Lodge. Were a large debris flow to come down Clear Creek, homes on that alluvial fan well above the level of the San Lorenzo River would be in its path. Once a debris flow is no longer confined in the deep V-shaped channel, it becomes difficult to predict where it will go on the alluvial fan surface. This is why a large number of homes are at risk in Brookdale and on other alluvial fans.
Harmon Creek and Malosky Creek both have the potential to generate debris flows that would inundate parts of downtown Boulder Creek. The northern part of town, including a cemetery, the elementary school, and numerous homes on both sides of Hwy 9, is built on a alluvial fan formed where Harmon Creek emerges from the mountain front. At the south end of town, homes on both sides of Hwy 9 built on the alluvial fan of Malosky Creek are at risk from debris flows. Both creeks are assessed as having a Low probability of generating a Moderate-sized debris flow during an intense rainfall event. Many homes and businesses are at risk from debris flow down these creeks. The San Lorenzo Valley Water District cleared out and deepened the channel at a chokepoint on Harmon Creek on its District watershed lands. “Chokepoints” are places along a creek, usually at a sharp bend, where a debris flow or large flood could potentially overtop the channel, creating a new flow path.
Many of the creeks that drain off Ben Lomond into Boulder Creek have Moderate hazards, including Jamison Creek, Peavine Creek, and Foreman Creek and several unnamed creeks in between. Most have small alluvial fans where they meet Boulder Creek, and these alluvial fans have homes on them. Given the number of creeks feeding into Boulder Creek that head in the burn zone, low-lying homes along Hwy 236 from the Boulder Creek Golf and Country Club to the town of Boulder Creek are at risk of debris flows and muddy floods even though they are outside the burn zone.
Drainages flowing to the southwest into Boulder Creek are assessed as having Low hazards from debris flows because the intensity of the burning was less there than in the headwaters of creeks west of Boulder Creek. Nevertheless, the flat river terrace occupied by the West Park Avenue neighborhood is locally at risk from debris flows and by flooding of debris-laden Boulder Creek.
The town of Boulder Creek was built at the confluence of Boulder Creek and the San Lorenzo River, and parts of it are subject to winter flooding in the absence of debris flows. Given that the section of the San Lorenzo River from Boulder Creek to just north of Riverside Grove would potentially receive debris flows from creek tributaries, as would Boulder Creek, the low-lying parts of the town of Boulder Creek are at risk of being inundated by sediment- and debris-laden floods.
South of Brookdale there are three creeks along Hwy 9 assessed as being capable of producing moderate-sized debris flows: Alba Creek, Marshall Creek, and Fall Creek. The latter two have homes in a hazard zone where the creeks join the San Lorenzo River. Fortunately, the probability of a debris flow being generated in these basins is rated as Low (0-20% in any given high-intensity rainfall event).
The probability of debris flows being generated in the CZU burn area adjacent to Felton is low (0-20%) due to low to very low burn intensity, and the predicted volumes are small, making the overall hazard Low. People whose property is only a few feet above the level of Fall Creek, Bull Creek, Shingle Mill Creek, and Gold Gulch Creek should probably keep in mind that there is a possibility of debris flows affecting their property, though the hazard is considered Low. More likely is flooding due to elevated run-off from the burned area. The new Felton Library and the adjacent CalFire station are only a few feet in elevation higher than Bull Creek, potentially placing them at risk. In addition, there is concern that where Bull Creek takes a sharp turn to the northeast at the edge of downtown Felton, a debris flow could jump the bank and continue southeast into town. Downtown Felton is probably at greater risk from a San Lorenzo River swollen with debris flows that enter from creeks to the north. It could overflow its banks, with areas such as Covered Bridge Park and Felton Grove potentially seeing effects similar to or worse than the great flood of 1982.
The San Lorenzo River has numerous creek tributaries that begin in the CZU burn zone from north of Riverside Grove to Felton on the south, each increasing the probability that the river would be affected by a debris flow during an intense rainfall event. Areas particularly at risk of inundation by a San Lorenzo Rivers swollen with debris are low-lying areas in southern Ben Lomond, Highlands County Park, parts of Felton, Paradise Park and the floodplain of the river south to the town of Santa Cruz, where it spreads over a large area near the outlet of the river to the sea.
Final thoughts
As a member of the research community that developed educational materials on volcanic hazards, I know that the most effective tools are videos that include dramatic footage of debris flows and their aftermath, accompanied by commentary by emergency personnel and local residents who lived through close encounters with debris flows. In that vein, listed below are links to two good videos on the Montecito, CA, debris flows in January 2018, which immediately followed the Thomas Fire, up until then the largest California fire on record. I recommend that all residents of San Lorenzo Valley view them, as they provide an excellent sense of the destructive power of debris flows and the challenges they present to emergency responders.
Montecito January 9, 2018 (Homeowner/survivor perspectives) – https://vimeo.com/307365160
Montecito debris flow (Emergency responder perspectives)
Follow up by figuring out the level of your hazard and whether you are likely to be ordered to evacuate this winter
ADDENDUM
Detailed instructions on how to determine if your property is in a debris flow hazard zone, and how to use the County Zonehaven debris flow evacuation map
Having read about debris flow hazards for the San Lorenzo Valley in general, determine the hazard level for your property as follows:
Go to the WERT report: https://www.smcgov.org/sites/smcgov.org/file/CZU%20Lightning%20Complex%20WERT%20Final%2010-6-20.pdf
Zoom in on the hazard map at the beginning of Appendix C (page 70 in the pdf) to find your property.
Your home may be in a hazard zone if it is in, on, or near:
• a red, orange, or yellow watershed (high, medium, and low hazard, respectively),
• purple streams that are likely to become debris-laden if a debris flow forms upstream,
• FEMA flood zones shown with blue diagonal lines, or
• one of the colored dots.
If not, you aren’t in a significant debris flow hazard zone. Still, if your home is located in the burned zone, you could experience small local debris flows on slopes above your home, and anywhere near streams coming off Ben Lomond Mountain could see local flooding due to greater run-off in the burned area and bulking up of creeks by sediment eroded from burned slopes.
If your home looks like it may be in a debris flow hazard zone, then find your home on one of the 26 more-detailed maps that follow p.70 in the .pdf of the WERT report. These maps have enough detail to locate your home precisely with respect to hazard zones. If you are near one of the numbered dots or areas, you can look up the site number on the “Value at Risk” table (starting on page 56 of the .pdf) to see the description of the hazard and the recommended action.
West of San Lorenzo River and Boulder Creek from Brookdale to Boulder Creek to Jamison Creek
As the most difficult areas to predict the paths of debris flows are alluvial fans, more detailed mapping was done by geologists and geomorphologists employed by the County and the California Geologic Survey of areas from Brookdale to Jamison Creek where alluvial fans are common and are favored sites for homes and businesses. If you live in this corridor, get more detail on the spatial distribution of hazards using the following directions.
Go to the California Geological Survey Boulder Creek Post-WERT Study at
The hazards are shown on page 88 in Plate 1b, Runoff Inundation Hazard Map. Note that north is to the left on this map.
In order of decreasing hazard:
Orange: High Energy: Regions likely to be occupied by large, channelized debris flows capable of sweeping away everything in their path.
Mustard: Moderate Energy: Regions likely to be occupied by moderate-energy, thinner debris flows where larger debris flows spill out of channels onto the flatter ground of alluvial fans or where the watershed can generate only small debris flows.
Yellow: Active Fan: Areas of alluvial fan with possible inundation if debris flows jump out of their channels due to blockage, typically at culverts where creeks cross Hwy 9 or Hwy 236 (green dots), or where the creek takes a sharp bend and the debris flow overflows the channel and keeps going straight downhill.
Tan: Inactive Fan: Areas of alluvial fan unlikely to be inundated unless debris flows take a dramatically different path from current channel due to exceptional blockage or takes a different path starting at the top of the alluvial fan.
The map also shows area that might be flooded by the San Lorenzo River due to increased run-off or bulking by debris.
Instructions on how to locate your property on the County Zonehaven evacuation map
Now that you’ve determined the debris flow hazard level or flooding potential of your property, determine its evacuation status.
Go to: https://community.zonehaven.com/
Click the search icon in the upper left. Enter your address. It will give you your Zonehaven zone number and its status.
Click the icon in the upper left that looks like a pile of papers to get the legend to the map. At this time (Nov. 25) only two colors are showing : Clear = Normal; Blue = Advisory (subject to mandatory evacuation). The blue advisory zones will receive an evacuation warning 48 hours before a forecasted rainfall event large enough to trigger debris flows, at which point the zones will be shown in yellow on the map. 24 hours before the event, a mandatory evacuation order will be issued, and the zone will be shown in reddish-orange. (Unfortunately, they used a topographic base that shows vegetation zones in various shades of green; don’t let this or the superposition of colors confuse you. If it does, switch to “Satellite” view in the lower left.)
Gail Mahood is a Professor Emerita, having retired in 2019 from the Department of Geological Sciences at Stanford University after 40 years of service as a faculty member and administrator. She is director-elect for the San Lorenzo Valley Water District.
The San Lorenzo Valley Post is your essential guide to life in the Santa Cruz Mountains. We're dedicated to delivering the latest news, events, and stories that matter to our community. From local government to schools, from environmental issues to the arts, we're committed to providing comprehensive and unbiased coverage. We believe in the power of community journalism and strive to be a platform for diverse voices.
Thank you Dr. Masood for your excellent analysis and advice, distilling multiple technical reports down into simpler terms.
We have a neighbor that has just brought in five or six large truck loads of loose dirt and piled them on a road above our property, Is this loose dirt an issue when soaked with extreme rainfall???? We are at 13440 Debby Lane, Boulder Creek.
Our house is below the loose dirt.
I tend to think, because it is on a flat surface, it will not wash down the hill.
My thoughts are baseless and circumspection.
I’d love to hear your opinion.
Hello Jeff,
Contact County Planning Department at (831) 454-2580. Also, call the Boulder Creek Fire Department at (831) 338-7222. Call today.